Key Growth Rates Mask Effects on Total GHG Emissions – Obama on The Same Page as Bush on “Energy Intensity” and Economic Growth
Projected Economic Growth and Rising Energy Demand May Exceed Projected Emissions Reductions
Expanded Fossil Production and Exports Also Reduce Any Real Emissions Reductions
Source: US EPA Regulatory Impact Analysis of CO2 proposed rule
“Unless emissions intensity improves faster than the economy grows, total emissions just keep rising.” ~~~~ NRDC – 8/23/05
The press and the public have been given – and clearly have formed – the blatently false impression that the EPA CO2 power sector proposed rule will reduce total US greenhouse gas emissions by 30% by 2030 (based on a 2005 emission baseline). That amounts to average rate of about 2% per year.
Seems like no one provided critical context and made important distinctions for that 30% number, including the significance of the 2005 baseline and the fact that the electric sector is less than 1/3 of total US emissions.
(Was “30% by 2030″ crafted by the Obama sloganeers that brought us “$10.10 by 2010″?)
Keep in mind that this EPA 30% reduction and my average annual rate are based on a model’s projections, which include many uncertain variables, like economic growth, “energy intensity” (units of energy per unit of economic growth), energy prices, and numerous other factors too complex to discuss here (wonks can go read the EPA IPM model documentation).
Estimated total US emissions have declined since 2005, primarily due to the 2008 economic recession and fuel switching from oil and coal to natural gas, although reliable and precise data are not available – and EPA does not even attempt to quantify or consider the lifecycle greenhouse gas emissions of natural gas, a fatal flaw and pro-gas bias we will talk about in future posts.
Some even estimate that NJ’s emissions have dropped by 24% since 2005.
But the takeaway point is, factoring in progress already made, the 30% number and my 2% per year reduction are actually lower.
Regardless of magnitude of the emissions reductions since 2005, the direction and the causes are clear – as is the fact that emissions have begun to rise again as economic growth has rebounded from the 2008 economic crisis.
The takeaway point is that projected growth – economic and energy demand – is key to understanding total emissions. It is the total emissions that must be reduced.
In addition to issues masked in various growth projections and complex energy models, another key conceptual point is that a reduction in the rate of growth of emissions is NOT a real reduction in actual emissions.
Yesterday, I illustrated the serious errors in that impression: the key to this mistake being the 2005 baseline year the 30% is derived from and the fact that the rule only applies to the power sector, which represents just 32% of US total emissions.
We also closed that post by suggesting that increasing emissions associated with Obama’s “all of the above” energy policy, particularly coal and gas exports, could put a large dent in – or wipe out – projected emissions reductions from the electric sector.
Today, we another another layer of basic math, but complexity to the press and public and look briefly – oh so briefly – at the effects of economic growth and increase in energy demand on total greenhouse gas emissions.
Let’s allow the Natural Resources Defense Council (NRDC), who played a critical role in designing the Obama EPA approach, explain the implications of growth in their valid criticism of the Bush Administration’s metric known as “energy intensity”:
“Emissions Intensity” — Pollution by Any Other Name?
Why emissions keep growing under the Bush administration plan.
The Bush administration’s voluntary approach to global warming focuses on reducing emissions intensity — the ratio of carbon dioxide to a measure of economic output. But under the administration’s plan, even as emissions intensity improves, total emissions will keep on rising. To combat global warming effectively, the government must focus its policy on reducing the total amount of heat-trapping pollution in the atmosphere.
Emissions intensity is the ratio of carbon dioxide emissions to a measure of economic output. For the economy as a whole, emissions intensity is usually expressed as emissions per dollar of gross domestic product. For the electricity sector, emissions intensity is usually expressed as emissions per kilowatt-hour of electricity generation.
Emissions Intensity vs. Total Emissions
Total emissions can keep increasing as emissions intensity improves. Indeed, the emissions intensity of the U.S. economy has improved for 30 years — partly because energy efficiency has improved, and partly because economic growth has been faster in relatively clean sectors, such as information technology and services. Nevertheless, total U.S. emissions have grown steadily because the economy has grown faster than the rate of emission intensity improvement:
- Since 1990 the carbon dioxide intensity of the U.S. economy fell by 20 percent. But GDP grew by 46 percent over this period. Hence, total carbon dioxide emissions increased by 17 percent.
- The carbon dioxide intensity of electricity production has improved by only 3 percent since 1990. Electricity consumption grew by 30 percent over this period while total carbon dioxide emissions from electricity production grew by 26 percent.1
Unless emissions intensity improves faster than the economy grows, total emissions just keep rising.
That is exactly right and the fundamental issue –
Economic growth and increases in energy demand, and the comparative rates between those two factors and the rate of energy intensity govern whether total emissions go up or down.
So, given that NRDC SUPPORTS Obama EPA plan, lets take a look and see how the EPA rule addresses this fundamental issue of economic growth and energy intensity.
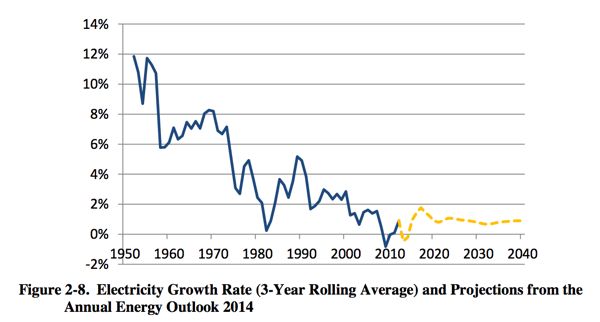
Look at the table above, and note that the Obama EPA projects the electric growth rate of 1 – 2% between now and the 2030 emission goal
I don’t have the underlying data for that table, but will that growth in electric demand outstrip the rate of projected emissions reductions?
We invite our quantitative readers to get the data and do the math.
And in closing, given the harsh NRDC criticism of the Bush focus on the metric of “energy intensity”, we leave you with how the Obama EPA addressed that issue – right up front, in the first paragraph, and in exactly the same way!
This rule, as proposed, would continue progress already underway to lower the carbon intensity of power generation in the United States. Lower carbon intensity means fewer emissions of CO2, a potent greenhouse gas that contributes to climate change.
Meet the new boss, same as the old boss.
And shame on NRDC for allowing formation of false media and public opinion.
[End note – and for the economists out there, we leave you with this EPA assumption and IPM model design: electric demand totally inelastic? (@ p. 2-27)
Demand for electricity, especially in the short run, is not very sensitive to changes in prices and is considered relatively price inelastic, although some demand reduction does occur in response to price. With that in mind, the EPA modeling does not typically incorporate a “demand response” in its electric generation modeling (see the discussion in Chapter 3) to the increases in electricity prices typically projected for EPA rulemakings.