Playing Games with Shifting Baselines
When 1990 Baseline Used, EPA Rule Amounts to a Tiny Reduction of Total US Emissions
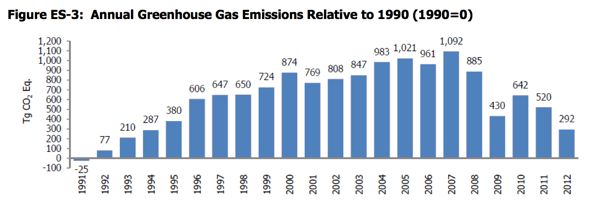
Source: US EPA GHG Emissions Inventory
[Important end note]
It will take me awhile to analyze the Obama EPA power sector CO2 emissions rule that was released today, so in the meantime, let me make a few basic and important points on it.
The above chart is from EPA’s most recent US Greenhouse Gas Inventory. The inventory is a commitment to the United Nations Framework Convention on Climate Change (UNFCCC)
An emissions inventory that identifies and quantifies a country’s primary anthropogenic1 sources and sinks of greenhouse gases is essential for addressing climate change. This inventory adheres to both (1) a comprehensive and detailed set of methodologies for estimating sources and sinks of anthropogenic greenhouse gases, and (2) a common and consistent mechanism that enables Parties to the United Nations Framework Convention on Climate Change (UNFCCC) to compare the relative contribution of different emission sources and greenhouse gases to climate change. […]
Parties to the Convention, by ratifying, “shall develop, periodically update, publish and make available…national inventories of anthropogenic emissions by sources and removals by sinks of all greenhouse gases not controlled by the Montreal Protocol, using comparable methodologies…”3 The United States views this report as an opportunity to fulfill these commitments.
As the “common and consistent mechanisms” and “comparable methodology”, the rest of the world uses 1990 as the base year for comparing and negotiating emissions reduction goals.
Here is a hypothetical example to illustrate how shifting baselines works when emissions are growing (and how sensitive goals are to projected growth or what they call the “Business as usual” (BAU) scenario, which typically has unrealistic and undesirable projected economic growth and increases in energy demand, while using low projected growth in efficiency and conservation and renewables):
Goal #1: a 10% reduction in emission from a 1990 baseline of 1,000 units = 900 units of emissions allowed
Goal #2: same 10% reduction in emissions, but from a 2005 baseline of 1,400 units = 1,260 units of emissions allowed.
The difference in measuring the 2 goals, depending on baseline year alone, is over 33%! (900 versus 1,260).
Look at the chart above, and guess which year the Obama EPA chose to make this statement about the emissions reductions from today’s CO2 power plant rule: (from the EPA Regulatory Impact Analysis (RIA))
3.7.1 Projected Emissions
Under the proposed rule, EPA projects annual CO2 reductions between 17% and 18% below base case projections for Option 1 in 2020 (reaching 26% to 27% below 2005 emissions 52), and between 24% and 25% below the base case in 2030 (reaching 30% below 2005 emissions). For Option 2, EPA projects annual CO2 reductions between 13% and 14% in 2020 (reaching 23% below 2005 emissions) and 17% in 2025 (reaching 23% to 24% below 2005 emissions).
Obama EPA did not use 1990 – they used 2005 as a baseline year, the second highest possible (only 2007 saw higher emissions).
OK, now that you see the games that can be played to inflate reductions by shifting the annual baseline (and growth projections), consider the fact that these emissions reductions (Option 1 – 17- 25% by 2030 – Option 2 – 13 – 24% by 2025), are for the electric sector only, and presented compared to projected emissions (suing different dates, 2030, and 2025!).
I don’t have the nervy model’s projected emissions growth assumptions, so can’t examine that right now, but according to EPA, the electric sector accounts for just 32% of total US emissions: (EPA RIA)
In 2012, the power sector accounted for 32 percent of total nationwide greenhouse gas emissions, measured in CO2 equivalent,13 a slight increase from its 30 percent share in 1990.
So, doing the math, we are talking about a emissions reduction of just 4 – 9.3% of projected US total emissions by 2030.
So, lets go back and look at trends in US greenhouse gas emissions from the EPA Inventory and see how much they increased from 1990:
In 2012, total U.S. greenhouse gas emissions were 6,525.6 Tg or million metric tons CO2 Eq. Total U.S. emissions have increased by 4.7 percent from 1990 to 2012
So, the Obama EPA rule, when compared to the world’s 1990 emissions baseline, amounts to just 0.7 – 4.6%.
That is peanuts folks. It just barely wipes out the growth in US emissions since 1990!
Even worse, keep in mind, at the same time you are being duped by these tiny emissions reductions, the Obama administration has presided over significant increases in US fossil fuel production, exports, and infrastructure development.
The increases in emissions associated just with the US coal and gas exports likely wipe out ant US power sector reductions under the EPA rule (haven’t done the math on this yet, pending).
[Note – here is a comment I made at NJ Spotlight on 5/29 – I welcome readers to do the math – here’s the data sources:
A few observations:
1) a significant part of the alleged prior reduction, in addition to the economic recession, was fuel switching from coal and oil to natural gas. But there is a serious debate about lifecycle emissions of gas – some scientists suggest that gas may be as bad as coal when lifecycle emissions are considered. So the alleged emissions reductions may not even be real.
2) I don’t think the EIA data on US emissions include coal exports – Obama has presided over and is supporting increases in coal exports. See:
http://www.eia.gov/coal/production/quarterly/
3) I don’t think the EIA data on US emissions include gas exports. Obama supports and has presided over significant increases in gas exports, see:
http://www.eia.gov/naturalgas/importsexports/annual/#tabs-supply-4
4) When lifecycle emissions and exports are considered, the emissions increases may dwarf any emission reductions that may result from EPA’s upcoming rules on existing power plants.