Archive

Archive for July, 2014

Are These The Kind Of Jobs Democrats Want for NJ?

July 17th, 2014 No comments
Worker with respirator and full protective gear at Troy Chemical. Source: NIOSH report.

Worker with respirator and full protective gear at Troy Chemical. Source: NIOSH report.

That man in protective gear was  a Troy Chemical Company employee. The photo is from a NIOSH Report on the facility.

I wrote about the outrageous situation at Troy on Monday – a very controversial and reveailing post that- as predicted – has generated crickets from media and friends alike.

So I ask: are these the kind of jobs that NJ Democrats want to attract to NJ?

Is this the kind of toxic manufacturing economy Democrats want to recreate in NJ?

Where a worker gets poisoned at the workplace?

Where the employer flouts environmental and occupational safety and health laws?

Where the corporate employer poisons the surrounding community?

Where the corporate employer pulls political strings – using suburban Republican legislators – to evade cleaning up the toxic mess they made?

Is this really the Democrats’ jobs and “manufacturing renaissance” vision and agenda? Really?

Say it ain’t so, Lou Greenwald. Say it ain’t so.

As we blow opportunities to grow good jobs in energy efficiency, solar, wind, geothermal, smart grid, distributed power, electric cars, rebuilding infrastructure, public transit, public housing,  education, libraries, art, music, local agriculture, taking care of seniors, mentoring youth, building parks and recreational facilities, cleaning up the environment, adapting to climate change, …

Categories: Uncategorized Tags:

Memo to Christie DEP: Dilution Is Not the Solution to Pollution

July 17th, 2014 No comments

DEP Proposed Change to Water Quality Standards Threatens Drinking Water, the Health of Bays & Estuaries and Fish and Aquatic Life

DEP Plan Would Allow Miles Of River to Dilute Pollution Discharges

mixing zone1

Tom Johnson at NJ Spotlight has a good story today about a major DEP proposal that would seriously weaken current NJ water quality standards and threaten drinking water supplies and the ecological health of NJ’s major rivers, bays, and estuaries, particularly Raritan Bay and the NY/NJ Harbor complex, see:

Bill Wolfe, New Jersey director of Public Employees for Environmental Responsibility (NJPEER), said the DEP’s proposed new approach fails to consider the ecological impacts of nitrogen on waterways.

“It ignores longstanding historical policy of ‘source water protection’ — that the policy burden on the wastewater dischargers is to protect water supplies — and shifts quite a bit of the cost and compliance burden onto the water purveyors,’’ Wolfe said.

Readers might want to examine the DEP’s “Source Water Protection” policy set under the federal Safe Drinking Water Act.

glass on eft is full of suspended solids. Why would DEP eliminate a standard for that?

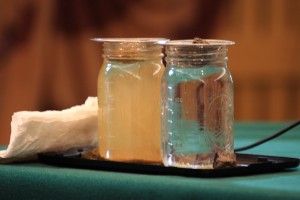
glass on left is full of suspended solids. Why would DEP eliminate a standard for that?

The primary pollutant addressed by the DEP’s plan is nitrate, although it also would eliminate current numeric standards for total dissolved solids, chloride (salt) and sulfate.

  • The Origin of The Current DEP Plan

The origin of the proposal goes way back to the Whitman administration, when sewage treatment plants sought to get relief from a series of costly stricter new pollution control permit limits.

To secure that relief, the polluters advocated a complex series of changes to water quality standards regulations and how those standards are measured and enforced in pollution discharge permits.

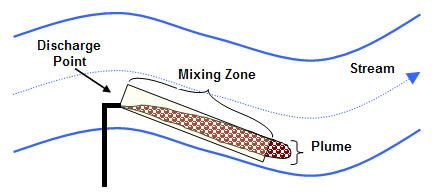
This is complex, but basically, water quality standards must be set to protect the designated use of a waterbody, i.e. fishing, swimming, drinking water, recreation.  In turn, pollution discharge permits must be shown to meet water quality standards. There are two ways to monitor and measure compliance with the water quality standard: 1) at the end of the discharge pipe; or 2) somewhere in the river or stream, typically after considering what is known as a “mixing zone” where pollution is allowed to dilute.

The key concept the polluters relied on was to allow more dilution of pollution, by seeking to expand what are called “mixing zones”, instead of measuring compliance with water quality standards at “end of  the discharge pipe”. This illustration shows that concept:

mixing zone

That dilution approach contradict fundamental policy on what was called pollution prevention and source water protection. The gist of both of those policies is that it is better – environmentally and economically – to avoid pollution in the first place than to clean it up. Since the 1990’s, those basic concepts and policies have since been forgotten or ignored or gutted.

At the time (circa 1997) environmentalists, myself included, were able to derail those efforts when, during a DEP “Stakeholder process”, we were able to obtain a memorandum from the DEP Assistant Commissioner for water resources Dennis Hart that stated:

“The proposed changes would increase the amount of carcinogens discharged to public water supplies”

I still recall reaction to that quote when we held a press conference blasting the DEP plan and it hit the newspaper. Governor Whitman herself had to deny that DEP would ever do that. Case closed. We blew that up and it hasn’t re-emeged since.

Until now, when polluters again have the receptive ear of a Governor and DEP Management Cabal that want to rollback environmental protections and provide “regulatory relief”.

  • The Problems Caused By Nitrate

NJ rivers receive billions of gallons of pollution discharges from hundreds of sewage treatment plants. Those plants do not have permit limits to control the discharge of total nitrogen.  Nitrogen comes primarily from human wastes and, without going into the chemistry of wastewater treatment, occurs in several forms: ammonia, nitrite, nitrate, and organic nitrogen.

As a result of the lack of pollution limits on total nitrogen, nitrate levels in NJ’s rivers are way too high and reaching critical levels that threaten both water supply and the ecological health of the river, especially the downriver bays and estuaries that receive the cumulative pollution loadings of multiple sewage treatment plants, in addition to non-point source pollution from storm water runoff.

At the same time, NJ relies on those same rivers that receive all those pollution discharges as sources of water supply.

Water is taken directly from the rivers and treated, or pumped to fill reservoirs. In either case, nitrogen pollution from sewage discharges creates several serious risks to drinking water.

Nitrate causes “blue baby syndrome”, which is potentially fatal in infants.  It is also a suspected carcinogen, endocrine disruptor, and can damage the thyroid gland and create a host of negative metabolic, development effects and health problems.

Nitrate aslo has indirect effects by increasing the growth of algae growth in the river water supplies. The algae must be treated and removed. The disinfection and treatment to remove this organic content in the water column increases the formation of tri-halomethanes (THM) – which are carcinogens – in drinking water.

Drinking water systems are facing compliance problems with drinking water standards (MCL’s) for nitrate and THM because our rivers are too polluted.

Nitrogen also causes ecological problems – it is a plant fertilizer and causes huge growth in algae. That leads to critically low dissolved oxygen levels that kill fish and other aquatic life.

  • DEP’s Alleged Justification for the Plan

Here is the DEP powerpoint presentation they made a few weeks ago to a “by invitation only” “Stakeholder” group.

Who are these stakeholders?

DEP provides 3 basic reasons for the Plan –  they parrot and could have been written by the sewer plant lawyers:

  • In NJ, all freshwater is designated as drinking water
  • Due to small size, not all streams are appropriate for drinking water intakes
  • Numerous permits have been adjudicated [challenged] on this issue, as a result both small and large dischargers have delayed upgrades

Translation: NJ DEP water quality standards are too strict and too costly to meet and we simply won’t upgrade the pollution controls at our plant to meet them and DEP can’t make us do so!

DEP then gets down to the regulatory nitty gritty:

  • water quality standards (SWQS) and Drinking Water Act both have nitrate criteria [standards] of 10 mg/L
  • criteria is an acute standard and is applied at the edge of the mixing zone
  • potable surface water treatment typically is not designed to remove nitrate

Translation: Notice how DEP mentions only drinking water and doesn’t tell you that SWQS fail to consider ecological impacts on eutrophication and low dissolved oxygen dead zone. DEP doesn’t say that Mixing zones are designed to allow dilution and provide relief from strict permit standards. DEP ask doesn’t tell you that sewage plants do not have nitrate limits and are not required to remove nitrogen!

But buried DEP’s second bullet and ignored is the fact that thePlan would essentially allow the entire river to be used as a mixing zone.

This is done by applying the new water quality standard not at the end of the pipe, and not at the edge of the mixing zone as is currently done, but at the water supply intake. In many places, this is miles downriver from the discharge location.

This amounts to a HUGE mixing zone!

Last, DEP doesn’t tell you that because drinking water plants do not remove nitrate, that all the nitrate in the river passes straight through to your tap! This is how DEP masks that:

  • potable surface water treatment typically is not designed to remove nitrate

And DEP doesn’t say what the health effects of that lack of treatment are (and its not just nitrate pollution that passes through untreated).

For the health effects of hundreds of other chemicals discharged upstream of our drinking water intakes, see:

Finally, the DEP Plan would let polluters that discharge to small streams and those without water supply intakes completely off the hook – DEP describes this as “relief”.

Multiple small sources have cumulative impacts and in addition to drinking water risks, nitrogen loads have ecological impacts and cause lower dissolved oxygen levels.

This under-protects our fish and aquatic life, particularly oxygen sensitive species like trout.

  • DEP Plan Conflicts with DRBC and US EPA Nutrient Standards and Control Strategies

Interestingly, the Delaware River was exempted from the proposal, because it would violate DRBC water quality standards and the downriver States (Pennsylvania and Delaware) members of the Delaware River Basin Commission (DRBC) would never allow DEP to get away with it.

DRBC is taking the exact opposite approach than DEP, and cracking down on nitrogen pollution loads to the river to protect the Delaware estuary. Excessive nitrogen loadings are creating dead zones and low dissolved oxygen levels that kill fish and aquatic life in the River and Bay.

 For details of that DRBC effort, hit this link to see that DRBC nutrient management initiative.

Similarly, for nearly two decades, the US EPA has been working on a nutrient TMDL for the NY/NJ Harbor Estuary complex, which will require huge nitrogen load reductions and impose strict new nitrate permit limits on NJ’s sewage treatment plant dischargers to the Passaic, Raritan, Rahway and Hackensack Rivers, and Newark Bay and NY Harbor, hit this link to read an overview.

  • What’s Next?

The DEP Plan has not been announced publicly and formally proposed as a regulation yet.

Therefore, it is not locked in stone and there is time to derail it.

To do so, I assume that the water purveyors will weigh in behind the scenes. There also needs to be some public pressure brought to bear on DEP Commissioner Martin and Governor Christie.

Reporters shouldPose the same question that was posed to Gov. WHitman:

Why would DEP allow more pollution to be discharged into public water supplies?

I will contact US EPA, because I have no confidence in DEP managers under the Christie regime.

Categories: Uncategorized Tags:

US Geological Survey Report Cites Declining Ecological Health of Barnegat Bay – Nutrient “Fingerprint” Study Shows Land Use as Primary Source of Pollutant Loads and Small Role For Fertilizers in Total Bay Pollution

July 16th, 2014 No comments

 Data suggest limited role of fertilizer dwarfed by other sources, primarily development

Gov. Christie’s Management Plan’s Heavy reliance on Fertilizer Law Misplaced

[Intro Note: Here is the most recent and comprehensive scientific review of the efficacy of fertilizer laws in reducing nutrient pollution loads/inputs, from Chesapeake Bay: Recommendations of the Expert Panel to Define Removal Rates for Urban Nutrient Management 

The study finds small nitrogen reductions result from fertilizer laws: just 4.5% from the 90% of lawns fertilized by homeowner “do it yourselfers” to a maximum of 20% for high risk laws managed by professionals.  

The Report goes on to assume various unverified reductions in total fertilizer sales, in fertilizer use, and in the reduction in nitrogen concentrations – all of which remain unverified by real data in NJ on sales and use. 

Of course, the best management approach is to restrict the amount and location of development and to not use fertilizers at all. No development = natural water cycle: recharge & infiltration of rainfall, minimize runoff, wetlands & stream buffers filter pollutants, streams assimilate natural loads.

No development = no homes, no lawns, no fertilizers – no roofs and parking lots, no huge volumes of polluted stormwater runoff.  end intro]

The US Geological Survey (USGS) published a Report last year that sought to identify specific sources on nitrate pollution to Barnegat Bay:

I mention this Report now, because I put a call in to Stan Hales of the Barnegat Bay Partnership last week to discuss their numerous objections to Rutgers Professor Mike Kennish’s research that I wrote about earlier in the week (Kennish, among other things, targets land use as the primary source of pollutants harming the Bay).

Before we discussed the status of Kennish’s research, Hales suggested that I review the USGS Report. He implied that it chemically fingerprinted fertilizers as a significant source of nitrogen loadings to the Bay – the inference left unsaid was that the Gov.’s fertilizer law was making progress in reducing those loads.

The USGS Report takes on added relevance right now, because some unnamed State officials have claimed the the fertilizer law signed by Gov. Christie is a significant step in restoring the Bay’s health (i.e. see this Patch story today, which challenges my characterization of the fertilizer law as “largely cosmetic“).

As if we can just keep on building out the watershed, as long as we reduce the nutrient concentrations and use of lawn fertilizer!

(aside from the far greater pollutant loads from development, the fact that if there is no residential development, then there is no fertilizer use is ignored)

[Update – to digress somewhat again, here’s what the Chesapeake Bay expert panel found about the technical basis for fertilizer management programs there, very similar to BBP:

The CBP has had an approved nutrient removal rate for urban nutrient management in effect for nearly 15 years (CBP, 1998, Appendix H). The entire documentation for the rate is provided below:

“… urban nutrient management leads to a reduction in urban fertilizer applied. Urban nutrient management involves public education (targeting urban/suburban residents and business) to encourage reduction of excessive fertilizer use. The CBP Nutrient Subcommittee Tributary Strategy Workgroup has estimated that urban nutrient management reduces nitrogen loads by 17% and phosphorus loads by 22%”

No scientific or modeling analysis could be found to support or document the nutrient reduction rates cited above. In addition, the Panel noted that the definition of the UNM was extremely ambiguous and could not be accurately measured, tracked or verified.

Therefore, the Panel concluded the existing definition and associated removal rates for the existing CBP-approved UNM practice could not be technically justified.”  – end update]

The Chesapeake expert panel also found just what I did previously:

In addition, the Panel was concerned about how effectively homeowners and commercial applicators might implement the UNM practices in the real world. Quite simply, what is written in a UNM plan may not be implemented on the lawn. In particular, homeowners may have difficulty in measuring or visualizing what a thousand square feet is, may not calibrate spreaders effectively, or simply want to use up the entire bag of fertilizer product. Similarly, homeowners may elect to follow some UNM practices, but not others, based on personal preferences and other reasons. The Panel concluded that UNM rates should reflect incomplete implementation of UNM plans.

So, let’s get back on point of this post – here are few relevant findings from the USGS  Report and observations regarding the fertilizer law:

Citing the prior findings of Dr.. Kennish with respect to eutrophication and the declining health of the Bay, USGS reviewed the literature and found:

Physical characteristics of the estuary, including its shallow depth and limited outlets for exchange with ocean water (poor flushing), render it particularly susceptible to the effects of nutrient loading and, over the last few decades, the ecological health of the estuary has deteriorated (Kennish and others, 2007). In particular, the estuary has experienced increases in macroalgal growth, harmful algal blooms, and turbidity, as well as oxygen depletion, declines in harvestable fisheries, and changes in species composition, including decreases in the biomass and size of seagrass beds (Kennish and others, 2007). The estuary has been classified as highly eutrophic based on the National Oceanographic and Atmospheric Administration National Estuarine Eutrophication Assessment (Bricker and others, 1999; Bricker and others, 2007).

Echoing the land use findings of Dr. Kennish’s Report, the USGS data collection found:

Concentrations of total nitrogen in the five streams appear to be related to land use, such that streams in subbasins characterized by extensive urban development (and historical agricultural land use) —North Branch Metedeconk and Toms Rivers—exhibited the highest total nitrogen concentra- tions (0.84–1.36 milligrams per liter (mg/L) in base flow). Base-flow total nitrogen concentrations in these two streams were dominated by nitrate; nitrate concentrations decreased during storm events as a result of dilution by storm runoff. The two streams in subbasins with the least development— Cedar Creek and Westecunk Creek—exhibited the lowest total nitrogen concentrations (0.16–0.26 mg/L in base flow), with organic nitrogen as the dominant species in both base flow and stormflow.

USGS summarized the literature on the sources of total loads:

On the basis of the 2009 estimate, the total annual load of nitrogen to the BB-LEH estuary was calculated to be 650,000 kilograms (kg) N per year. Results of the study indicate that nitrogen transported to the estuary in surface water contributes 66 percent of the total nitrogen load, direct groundwater discharge contributes 12 percent, and direct atmospheric deposition to the estuary surface contributes 22 percent. Total nitrogen yields for basins in the more developed areas (greater than 10 percent developed) were about twice those for basins in less developed areas (less than 10 percent developed).

With respect to the role of fertilizers, USGS did NOT conclude that they were the primary source of nitrogen to the Bay – and that atmospheric devotion – previously claimed by some to be a major source – is NOT a major source:

Measurements of nitrogen and oxygen stable isotope ratios of nitrate in surface-water samples revealed that a mixture of multiple subsurface sources, which may include some combination of animal and septic waste, soil nitrogen, and commercial fertilizers, likely contribute to the base-flow nitrogen load. The results also indicate that atmospheric deposition is not a predominant source of nitrogen transported to the BB-LEH estuary from the watershed, although the contribution of nitrate from the atmosphere increases during stormflow.

The USGS did find that fertilizers were a significant source, but only in groundwater  – not surface water or the Bay as a whole – and only in 2 wells:

Groundwater samples collected from five wells located within the BB-LEH watershed and screened in the unconfined Kirkwood-Cohansey aquifer system were analyzed for nutrient and stable isotope composition. Concentrations of nitrate ranged from not detected to 3.63 mg/L, with the higher concentrations occurring in the highly developed northern portion of the watershed, indicating the likelihood of anthropogenic sources of nitrogen.Isotope data for the two wells with the highest nitrate concentrations are more consistent with fertilizer sources than with animal or septic waste.

So, based on the USGS Report, sources of fertilizer pollutant loads to the Bay are far less significant than those from land use and development.

One limitation of the sampling design is that the contributing area for the surface-water samples contained a mixture of land uses and, therefore, a mixture of nitrogen sources. Future monitoring efforts may include stable isotope sampling in smaller sub- basins dominated by single land uses to improve understanding of the relation between specific land uses and their isotopic signatures within the watershed. Analysis of such samples would help to further characterize the relative importance of terrestrial nitrate sources—animal and septic waste, soil nitrogen, and commercial fertilizers—and aid in prioritizing strategies for reducing nutrient loads such as controlling development, reducing application of commercial fertilizers, and implementing stormwater management. 

This USGS finding suggests that because fertilizers are a relative small source of total nitrogen to the bay, and because development is the primary source of pollutant loadings, that there is a very limited role for restrictions on the nitrogen content of fertilizers in reducing nitrogen loadings to the Bay.

Management efforts must be far broader than Gov. Christie’s reliance on the fertilizer law. As I wrote:

Regardless of time release or percentage of the nitrogen content, a fertilizer ordinance CAN NOT ADDRESS TOTAL NITROGEN LOADINGS.

On top of this limited role, the strength of the fertilizer law itself is exaggerated:

1) the sponsor of the fertilizer bill Gov. Christie signed, Senator Beck (R-Monmouth) told me to my face, in her office, that Scott’s (the largest fertilizer manufacturer) did not oppose the bill because she had negotiated revisions that resulted in the fact that it would hove no impact – none – on their fertilizer manufacturing.

If negotiations on the bill resulted in a bill that was not opposed by the largest fertilizer manufacturer, and it would have no impact on the fertilizer they produced, how is that something to brag about?

2) I’ve done hypothetical calculations that show that the fertilizer law, because State officials exaggerate its impact, could result in MORE nutrient pollution entering the Bay, not LESS.

This is because if people think that the fertilizer they buy at the store is “weak” (or diluted), they may apply MORE or it and apply it MORE frequently.

Think 3.2% “near beer”. [Or, as the Chesapeake expert panel found:

N losses were also influenced by the type of fertilizer and the number of soluble N applications. 

The law may be having this unintended consequence – has anyone provided fertilizer sales and use data BEFORE and AFTER the law?

3) The Rutgers study recommended a set of management requirements unrelated to fertilizer use.

The Rutgers Report stated the State must do FAR MORE than it is now doing – and Dr. Kennish previously testified that Gov. Christie’s Plan had to be “seriously ramped up”.

4) I am not aware of any data that shows that the fertilizer law has had any measurable impact on the nitrogen loadings to the Bay or on reducing the Bay’s eutrophication problems. None at all.

Yes my good friends at Brick Patch,  I am a critic, but I deploy science, facts, and the law to expose the policy flaws and failures at DEP – since 1994.

[End note – DEP has failed to protect vegetated stream buffers by upgrading designation to Category 1, which provides protection for 300 foot wide buffers, each side of stream.

Here is the importance of protecting those buffers, from our Expert panel again:

Historically, concerns with nitrogen leaching from lawns have been driven by human health concerns regarding nitrate contamination of drinking water – particularly groundwater supplies. For this reason the concentration of leachate remains a significant concern. When it comes to urban nitrogen load reduction, however, nitrate leaching are not synonymous with total N loads delivered to the Bay. Nitrate leaching introduces soluble nitrogen into subsurface flow paths that may encounter reducing conditions supporting denitrification.

Indeed, the potential for denitrification along subsurface flow paths is a principal nitrogen removal mechanism expected from riparian and vegetated buffers. “

page23image198488

page23image198760Why aren’t vegetated buffers a focal point?

Compacted soils in the coastal zone would lead to more surface runoff, and thus the buffers (and wetland systems) are even more critical to filter and remove fertilizer nutrient pollutants.

And the role of fertilizers as a percentage of total loadings is limited – again, consistent with USGS findings, the Chesapeake expert panel found:

Recent research indicates that lawns are highly retentive of fertilizer N under typical application rates and lawn conditions. Groffman et al (2004) found approx 75% of fertilizer N was retained in urban lawns monitored in Baltimore. Kaushal et al (2011) used N isotopic ratio signatures to show watershed export of nitrogen is not directly proportional to fertilizer inputs in Baltimore watersheds. Though lawn fertilizer is a significant input to the watersheds, the isotopic signatures of stream nitrogen suggest sewage is a much more significant N loading source than lawn fertilizer. 

So, what do we know about leaking sewer pipes and failing septic systems as sources of pollution to Barnegat Bay and what is DEP doing about that?

Finally, as I’ve written for years now, the voluntary BBP program lacks accountability, which the regulatory TMDL would address – again, our expert panel:

Accountability Mechanisms

The Panel concurs with the conclusion of the National Research Council (NRC, 2011) that verification of BMP installation and subsequent performance is a critical element to ensure that pollutant reductions are actually achieved and sustained across the watershed. The Panel also concurred with the principles and protocols for urban BMP reporting, tracking and verification developed by the CBP Urban Stormwater Workgroup (USWG, 2012).

The Panel felt that accountability was especially important for UNM plans since they are not a tangible or structural practice like many other urban BMPs. UNM plans represent a voluntary intention to implement specific lawn care practices in the future, and not necessarily an assurance that they have actually been implemented on the lawn.

Categories: Uncategorized Tags:

Chesapeake Bay Experience Directly Relevant to Barnegat Bay

July 16th, 2014 No comments

A Tale of Two Bays

Gov. Christie, DEP, & Local Officials “Sitting on the Crock of the Bay”

At this point, it looks like a race between seal level rise and eutrophication

“Basically, what we’re seeing is that the government has had its thumb on the scale for years,” said J. Charles Fox, former secretary of the Maryland Department of Natural Resources. “There’s no question now that the government was inflating progress in the Chesapeake Bay.”

He attributed the overstatements to “an institutional bias to show progress.”  ~~~ Bay Pollution Progress Overstated (Washington Post)

A decade ago tomorrow, page one of the Washington Post contained an explosive investigative story that began like this:

At news conferences, on its Web site and in its regular publications, the government agency leading the cleanup of the Chesapeake Bay has documented more than a decade of steady progress.

The Chesapeake Bay Program has reported that the flow of major pollutants from rivers into North America’s largest estuary has declined nearly 40 percent since 1985, bolstering the claims of politicians in Virginia, Maryland, Pennsylvania and the District that they were “saving the bay” and helping the states fend off criticism and lawsuits from environmentalists.

Those reports, however, significantly overstated the environmental achievements.

Please read the entire WaPo story, because it tells an all too familiar tale of how economic development and political pressures on bureaucrats to show progress are used to deny problems and derail effective planning and regulatory solutions.

The Post story documents how science is manipulated to mislead the public about the actual state of the environment.

The Post investigation shows how the actual performance of various management programs is exaggerated, in this case, the failed locally controlled voluntary “partnership” programs that were put in place to avoid consideration of land use restrictions and far tougher federal “top down” regulatory mandates by EPA.

The serious problems revealed by the Post story lead to an Executive Order by President Obama (CHESAPEAKE BAY PROTECTION AND RESTORATION), revoking the flawed local voluntary partnership effort and re-establishing a federal leadership role under the Clean Water Act in managing the Chesapeake Bay, a national treasure:

Restoration of the health of the Chesapeake Bay will require a renewed commitment to controlling pollution from all sources as well as protecting and restoring habitat and living resources, conserving lands, and improving management of natural resources, all of which contribute to improved water quality and ecosystem health. The Federal Government should lead this effort. Executive departments and agencies (agencies), working in collaboration, can use their expertise and resources to contribute significantly to improving the health of the Chesapeake Bay.

The Obama Order was followed by a subsequent investigation by the US General Accounting Office (GAO), required by Congress in 2008, see:

Required by Congress, the GAO investigation was initiated in response to the Washington Post expose. GAO concluded:

Moreover, there are now two groups that plan to assess bay health. The Strategy calls for the Federal Leadership Committee to coordinate with the watershed states to align these assessments. However, the status of this alignment is unclear, and if these groups use different indicators to assess bay health, confusion could result about the overall message of progress made. GAO recommends that EPA work with federal and state stakeholders to develop common goals and clarify plans for assessing progress.

EPA regulatory oversight triggered the “TMDL” on the Chesapeake, which addressed some of the GAO recommendations related to common goals, clear standards, performance milestones, and assessment methods.

The Chesapeake experience revealed by the WaPo investigation, the GAO Report, and the EPA TMDL regulatory process are of direct relevance to the management of NJ’s Barnegat Bay.

Just like the Chesapeake failure that led to the Obama Order, GAO Report, and EPA TMDL:

1. DEP and the Barnegat Bay Partnership are in denial about the ecological decline of the Bay, and downplay problems

2. DEP and BBP are “inflating progress” and misleading the public about the overall health of the bay and the performance of local management plans

3. DEP and the BBP prefer to continue a failed management approach that relies on local, voluntary, consensus and partnership efforts;

4. Gov. Christie, the DEP and the BBP lack clear and shared goals

5. Gov. Christie’s and the DEP’s Management Plan lack

  • science and ecologically based monitoring and assessment methods
  • clear and enforceable standards to assure the Plan meets goals and objectives
  • planning and regulatory tools to implement the Plan
  • action forcing mandatory timetables to implement the plan
  • performance measurement methods and accountability measures to evaluate the Plan

All of these fatal defects can be remedied by adoption of a TMDL by NJ DEP, subject to robust public involvement and close oversight by US EPA.

Gov. Christie vetoed bi-partisan  legislation that would do just that.

And Christie got support from coastal environmental groups , some of whom just so happen to be funded by the Christie DEP.

But, the Governor will be long gone when the Bay collapses, the inevitable result – a case of when not whether – if current efforts are not seriously ramped up.

So, if you care about nothing else, just ask yourself, because stinging Jellyfish are nothing:

what would happen to the tourist economy and Bay property values in the event of a major harmful algal bloom that resulted in massive fish kills, huge odor problems, and prohibitions on fishing, boating, or swimming in the Bay?

What kind of hit would the market price of those Bay homes take? Sandy in scale, perhaps worse.

At this rate, it looks like a race between seal level rise and eutrophication to see which can kill the Bay first.

Categories: Uncategorized Tags:

Rutgers Scientific Research Conclusively Documents Ecological Decline Of Barnegat Bay

July 15th, 2014 No comments

Christie DEP Blocking Release of Embarrassing Report for Political Reasons

DEP Manufactures Doubt To Prevent Publication of Damning Science

[Update: 7/18/14 – Killer Editorial:  State Apathy Killing Barnegat Bay

What should happen now is that the state declare Barnegat Bay an “impaired” waterway under the Clean Water Act, which would force DEP to create a strict action plan to reduce pollution into the bay. That’s what an activist group of former government environmental workers is calling for, and there appears to be little responsible choice now. Otherwise, the state might as well pull the plug and let the bay die.

Taking such aggressive cleanup action, however, means some meaningful — and potentially costly — regulatory restraints on coastal development, and Christie undoubtedly wants no part of that.

Update: 7/16/14 – read Kirk Moore’s superb Asbury Park Press story: NJ Must Act On Bay Report, Watchdog Group Says

“This is amazing that DEP won’t release the study when it’s been in a peer-reviewed journal,” Bill Wolfe of Public Employees for Environmental Responsibility said Tuesday about highlighted portions of the Rutgers report.

The findings show the bay “may be spiraling to a point of ecological no return,” said Wolfe, a former DEP analyst who obtained the report and related documents through a Freedom of Information Act request to the U.S. Environmental Protection Agency, which provided funding for the $480,000 project.

[Update below – explanation of how DEP is blocking release]

A Rutgers research Report, completed over a year ago, comprehensively documents the ecological decline of Barnegat Bay.

The Report proves, beyond any doubt, that the Bay is “impaired” and it recommends that a “Total Maximum Daily Load” (TMDL), required under the Clean Water Act, be implemented as the primary means of reducing  current pollution, preventing future pollution, and restoring the health of the Bay.

But the Christie DEP is blocking the release of this research Report in order to avoid compliance with the Clean Water Act’s TMDL requirements and to prevent exposure of the failure of Gov. Christie’s Management Plan and serious flaws in DEP water quality standards, monitoring, and assessment programs, which fail to show the true declining health of the Bay.

Documents we obtained via FOIA of US EPA reveal a concerted effort by DEP to “manufacture doubt” – a fraudulent tactic pioneered by the tobacco industry – and undermine the credibility and scientific conclusions of the Rutgers research.

The Report also ties the Bay health to nutrient pollution caused by over-development and thus would lead to enforceable regulatory restrictions on future land use in the watershed, as is therefore strongly opposed by local builders and economic development interests.

Read the documents and get the full story, from our friends at PEER:

banner

For Immediate Release:  Tuesday, July 15, 2014

Contact:  Bill Wolfe (609) 397-4861; Kirsten Stade (202) 265-7337 

Study Documenting Barnegat Bay Decline Kept in Limbo

Land Use Driving Nutrient Loading; Pollution Diet Needed to Avert Tipping Point   

Trenton — The first quantitative biotic index for Barnegat Bay finds the estuary in steep decline and calls for major changes in how it is managed, according to text posted today by Public Employees for Environmental Responsibility (PEER).  The comprehensive study by Rutgers University researchers has been kept from publication by the Christie administration which claims Barnegat Bay is a success story.

The massive study bears the unwieldy title “Assessment of Nutrient Loading and Eutrophication in Barnegat Bay-Little Egg Harbor, New Jersey in Support of Nutrient Management Planning” and is authored by Rutgers researchers Michael Kennish, Benjamin Fertig and Richard Lathrop.  It finds Barnegat Bay to be in “significant ecological decline” and in a “highly eutrophic” condition.  The “poorly flushed” estuary does not easily rid itself of pollutants.  The net result is an increase in brown tides (harmful algal blooms), loss of eelgrass beds, shrinking abundance of clams and loss of marine habitat.

The study concludes that declines in water quality are “strongly related to land use” and finds the highest levels of nutrient loads connected to developed areas, as opposed to forested tracts.  As development spreads it spurs “cascading changes” that push the Bay toward an as yet undetermined “tipping point.”

“This study conclusively documents that Barnegat Bay is in deep trouble and may be spiraling to a point of ecological no return,” stated New Jersey PEER Director Bill Wolfe, who obtained the study through a Freedom of Information Act request from the U.S. Environmental Protection Agency (EPA).  “The science is inescapable that our land use practices directly affect the health of the Bay.”

Governor Chris Christie had vetoed legislation requiring adoption of a pollution diet in the form of a Total Maximum Daily Load (TMDL) for Barnegat Bay.  Instead, Christie signed a largely cosmetic bill on lawn fertilizer controls.  By contrast, the Rutgers study recommends a much stronger prescription:

  • The study says adoption of a TMDL containing a “strict limit on nutrient and phosphorus loads” is “a necessary element” for recovery of the Bay;
  • It calls for stronger storm-water controls, open space preservation, soil restoration and other measures to prevent pollutants from reaching the Bay; and
  • Underlines that a TMDL and better land management are not an either/or proposition but that achieving both is “critical” to Bay recovery.

“This study should be guiding state policy on Barnegat Bay rather than gathering dust on a shelf,” added Wolfe who has been advocating a TMDL for the ailing estuary.  “The Christie people do not want this study to see the light of day because it shows that their so-called recovery package for Barnegat Bay is itself just a different type of ‘nutrient load.’”

###

See the study’s “Key Findings’

Look at its recommendations

 View the Executive Summary

Revisit bogus Christie attempt to declare the Bay unimpaired


New Jersey PEER is a state chapter of a national alliance of state and federal agency resource professionals working to ensure environmental ethics and government accountability

[Update: I just got a good question from a reader asking how DEP is blocking release of this study.

I should have made that more clear.

The study is EPA funded, but partially funded by the DEP. For administrative reasons, EPA decided to contract the management of the research to a private professional water resource group in New England.

DEP serves on the study’s Technical Advisory Committee (TAC). The other TAC members are EPA and Barnegat Bay Partnership (BBP). The BBP is funded by EPA and DEP, so they know which way the wind blows, and have raised similar objections to the study, including some criticisms that lack scientific merit.

The TAC signed off on the scope of work and QA/QC plans for the study, met regular for over 2 years with Rutgers to review data and progress, and must sign off on the final report before it is released. Despite all this, late in the process the TAC raised numerous significant criticisms of the study – two rounds of review comments and responses from Rutgers (over 100 pages, be glad to provide upon request).

This is a classic example of “manufacturing doubt” – by injecting false uncertainty into science to undermine findings you disagree with.

The New England group – at EPA and or DEP request – is conducting a peer review process of the work. They refused to provide the documents to me so I obtained them by FOIA to EPA. So EPA views the report as “final”.

New England won’t release until peer review comments are in and DEP and EPA approve.

DEP is using TAC and approval powers to bury this report and prevent its release.

Ironiclly, the Report was published in the peer reviewed scientific literature in the March  edition of the journal Estuaries and Coasts – that version provided upon request as swell – just email me.

The fact that the study passed scientific journal peer reviews but not DEP strongly suggests that DEP is blocking it for political reasons. – end update.]

Categories: Uncategorized Tags: