NJ is “Separate and Unequal” When it Comes to Pollution and Health Risks
Industry Lies on Cumulative Risks and Environmental Injustice
Christie Administration In Denial and Delay Mode
Lies by the chemical industry about the environmental and health effects of their products are nothing new – entire books have been written about that (e.g. see: Doubt is Their Product – How Industry’s Assault on Science Threatens Your Health by professor David Michaels).
But, those lies have become much more nuanced and sophisticated, typically requiring scientific and legal expertise to detect and expose, as professor Michaels did so effectively in his superb book.
So, I’m actually happy to report, that nuance and sophistication were not the case recently in Trenton, when Hal Bozarth, chief lobbyist for the NJ Chemical industry (AKA “The Godfather of NJ Toxics”), repeatedly and obviously lied and mislead in testimony to the Assembly Environment Committee on an environmental justice bill, A3836.
(see Tom Johnson at NJ Spotlight story on the May 13 hearing: Bill Would Enforce Environmental Justice, Keep Polluters out of Poor Urban Areas)
I’m happy to report those lies and distortions because they open the door and become an opportunity to educate legislators and media on long ignored and complex scientific and regulatory issues. Ironically, Bozarth’s testimony was so egregious that it actually advances the compelling arguments in favor of the bill.
This is a very big deal, because the chemical industry blatantly lied about EPA and DEP research and air monitoring initiatives in NJ. Those lies were used to support a series of false or misleading claims that:
- there is no scientifically valid methodology currently available to assess cumulative impacts and/or cumulative risks from chemical exposures;
- the best available studies in 3 NJ urban areas indicate that health risks are below levels of concern;
- the best available studies in 3 urban areas suggest that the detected pollutants of concern are emitted by mobile sources (cars, trucks, ships, planes, trains) and not by stationary sources like chemical plants and refineries; and
- US EPA and NJ DEP studies have found that air quality is no worse in urban NJ than elsewhere in the state.
So, let’s get right down to it and start with what the bill does and exactly what Bozarth lied about in his testimony.
The key technical feature of the bill involves what the wonks call “cumulative impacts” or “cumulative risk”.
The bill would authorize DEP to deny environmental permits where consideration of cumulative impacts pose unaceptable risks.
I lay some of this out in a letter today to Chairwoman Spencer, the bill’s sponsor
Dear Chairwoman Spencer:
Re: clarification and correction of chemical industry testimony on A3836Apologies for delay in providing this information, which I promised during my May 13, 2013 testimony before your committee on your bill, A3836.
As I testified, Mr. Bozarth’s testimony was false and/or misleading.
As promised, I now would like to followup in more detail to point out specifically where the testimony of Mr. Bozarth of the NJ Chemistry Council was false and/or misleading in statement or inference, as follows.
Lies and distortions by the chemical industry about the environmental and health effects of their products are nothing new – entire books have been written about that subject (e.g. see: Doubt is Their Product – How Industry’s Assault on Science Threatens Your Health by professor David Michaels).
There are also relevant science, regulatory, and policy documents that Bozarth failed to mention that I will touch on briefly.
1. Mr. Bozarth testified that US EPA and NJ DEP had conducted cumulative risk studies in Elizabeth, Paulsboro, and Paterson, and found no cumulative risk problems, inferring that there were no “unreasonable risks” the bill sought to address. Both statements are false and misleading, as set forth below.
2. Directly contradicting that statement, he then testified that scientific tools to assess cumulative risk do not yet exist.
3. Bozarth stated that those studies found that air quality is urban areas was no worse than in other areas of NJ. THis statement is false according to DEP data in the Report cited by Mr. Bozarth, as set forth below.
Taken in order, here are the facts, with verbatim excerpts of the documents and links to the studies Bozarth cited in his testimony:
1. Elizabeth and Paulsboro studies
The Elizabeth (Mabel Holmes Middle School) and Paulsboro (High School) studies were conducted by US EPA. These studies did not assess or include findings on cumulative risk, as stated by Bozarth.
The EPA studies of outdoor air quality near two NJ schools were part of a national monitoring program purportedly designed “to understand whether outdoor toxic air pollution poses health concerns to schoolchildren.” The EPA school monitoring program was triggered by a USA Today investigative series. A commitment for EPA to conduct the study was extracted by US Senate Environment and Public Works Committee Chairwoman Barbara Boxer during Lisa Jackson’s EPA confirmation hearing
(look at the photo I took of that at this link: http://www.wolfenotes.com/2009/01/politics-versus-science/#more-497
The EPA schools study did not emerge from within EPA professionals or a credible scientific body, and the study itself reflects inadequate scientific development and vetting made difficult by political intervention.
EPA sampled outdoor air in the area of 63 schools in 22 states – see EPA’s description of the program, with all data and findings:
The EPA study methodology did NOT conduct cumulative impact or cumulative risk assessment, but instead was based on air monitoring and individual chemical specific analysis, based on a comparison with EPA derived health screening values for individual chemicals.
There are serious flaws in this study, including:
a) the small number of chemicals sampled – industry emits thousands of chemicals and the Clean Air Act regulates 187 “Hazardous Air Pollutants (HAP’s), yet EPA sampled for just 45 compounds;
b) the EPA study failed to consider community susceptibility or cumulative impacts or cumulative risks from human exposure to multiple chemicals via multiple exposure pathways (e.g. air, water, soil, food) – or synergistic or subtle developmental effects;
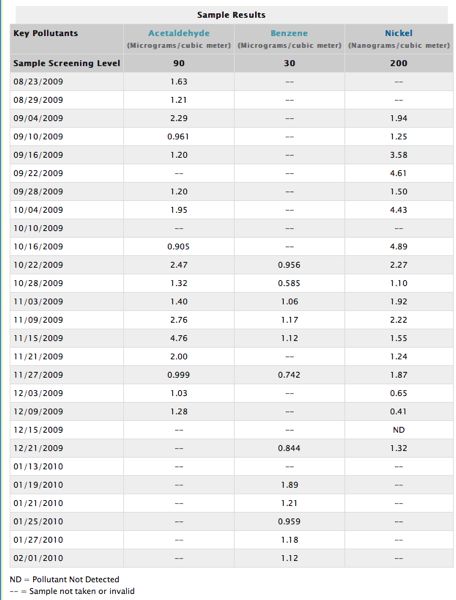
c) EPA screening values were over 200 times HIGHER than NJ DEP health based screening values. If EPA had used NJ DEP’s screening values, almost all samples would have exceeded health levels of concern.
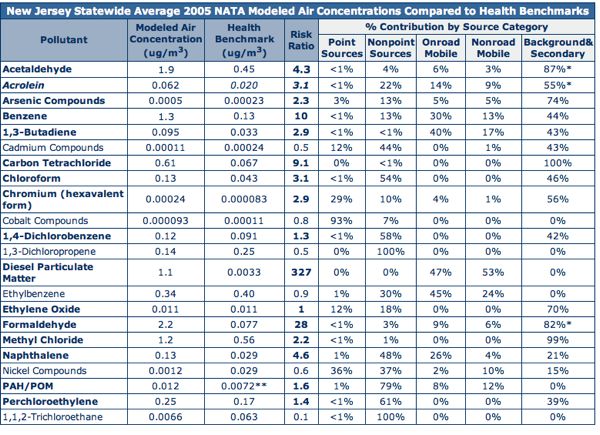
For example, EPA used screening values of 90 micrograms/cubic meter for acetaldehyde and 30 micrograms/cubic meter for benzene, a known human carcinogen.
In comparison, the NJ DEP’s “health benchmark” screening values for acetaldehyde is 0.45 micrograms/cubic meter (200 times lower than the EPA value) and 0.13 micrograms/cubic meter for benzene (230.7 times lower than the EPA value). For DEP “health benchmarks” and their derivation, see this link:
http://www.nj.gov/dep/airtoxics/njavg05.htm
d) the EPA selected pollutants that are emitted by mobile and stationary sources, making it difficult or impossible to determine the source of the pollutant detected with any degree of confidence. Accordingly, Mr. Bozarth’s repeated claims that the large majority of the pollution comes from mobile sources finds no basis in this particular study.
2. Paterson Study
The Paterson study was funded and reviewed and approved by US EPA, but conducted by NJ DEP. It is known as “UCAMPP”, for Urban Community Air Toxics Monitoring Project – see this for DEP study:
http://www.state.nj.us/dep/dsr/paterson/
First of all, in contrast to EPA studies above, the Paterson DEP UCAMPP study initially WAS designed as followup “environmental justice” research project and the final draft Report did include cumulative risk assessment findings.
Specifically, page 61 from Draft report showed unacceptably high combined cancer risks – see a copy of that page here:
http://www.wolfenotes.com/2010/02/dep-guts-science-on-cumulative-cancer-risks-in-paterson-nj/
But, as I wrote on February 10, 2010, those and other important findings were deleted from the version released to the public. This amounts to political suppression of scientific findings, a corrupt practice that has no place in government.
Secondly, the Paterson study used an air monitoring station located in Chester, NJ as a “background” station.
Contrary to Mr. Bozarth’s claim, according to DEP’s data, the air in Chester NJ is far less polluted than the air in Paterson, and the people of Paterson are exposed to significantly higher health risks from air pollution, compared to residents of Chester.
As some others testified on your bill, this is the definition of “separate and unequal”.
3. Previous DEP conclusions on “disproportionate burden” and available cumulative risk tools
A December 2009 DEP Report documented that NJ’s urban areas were suffering disproportionate pollution burdens – see:
A Preliminary Screening Method to Estimate Cumulative Environmental Impacts
http://www.state.nj.us/dep/ej/docs/ejc_screeningmethods20091222.pdf
As I wrote back on December 5, 2009:
“DEP considered 9 indicators of environmental and/or public health impact: 1. cancer rates; 2. diesel emissions; 3. ambient benzene levels (a carcinogen); 4. traffic (all); 5. traffic (trucks); 6. density of DEP regulated industrial facilities; 7. density of toxic waste sites; 8. density of dry cleaners (toxic air emissions) and 9. density of junkyards.
For every single one of those indicators, the adverse impacts increased directly as the percentage of minority and poor residents increased.
DEP data conclusively demonstrates that poor and minority communities bear disproportionate impacts.
The strength of the correlation between race and income and adverse environmental & health impact demands that DEP take action to remedy this injustice. DEP must enforce existing environmental regulations to mitigate these impacts and develop tough new standards to prevent and better protect already over-burdened EJ communities.”
As I’m sure you are aware, the NJ Environmental Justice Advisory Council also has done considerable work on this issue since then, including a Report on cumulative impact methodologies and issues
STRATEGIES FOR ADDRESSING CUMULATIVE IMPACTS IN ENVIRONMENTAL JUSTICE COMMUNITIES
http://www.state.nj.us/dep/ej/docs/ejac_impacts_report200903.pdf
Also please see my followup post of April 11, 2012
Dissenting Report Rips Christie DEP Commissioner Martin On Environmental Justice
4. EPA “Framework for Cumulative Risk Assessment”
Mr. Bozarth implied that cumulative risk is not developed scientifically or in regulatory policy. Yet EPA has had a cumulative risk assessment framework for over a decade.
Here is just one example: the National Air Toxics Assessment Report (see 2005) technical basis document states the following: (access is restricted to the quoted and cited EPA 2003 document)
“The national-scale assessment described in this document is consistent with EPA’s definition of a cumulative risk assessment as “an analysis, characterization, and possible quantification of the combined risks to health or the environment from multiple agents or stressors” (EPA 2003; p. 6). EPA’s Framework for Cumulative Risk Assessment (EPA 2003) emphasizes that a conceptual model is an important output of the problem formulation phase of a cumulative risk assessment. The conceptual model defines the actual or predicted relationships between exposed individuals, populations, or ecosystems and the chemicals or stressors to which they might be exposed. Specifically, the conceptual model lays out the sources, stressors, environmental media, routes of exposure, receptors, and endpoints (i.e., measures of effects) relevant to the problem or situation that is being evaluated. This model takes the form of a written description and a visual representation of the relationships among these components (EPA 2003). The conceptual model sometimes can include components that are not specifically or quantitatively addressed by an assessment, but that are nevertheless important to consider.”
“6.2.2 Multiple Pollutant Risk
The individual lifetime cancer risk resulting from exposure to multiple air toxics is estimated by summing the chronic cancer risk for each air toxic that can be quantified. This estimate of risk focuses on the additional lifetime risk of cancer predicted from the exposure being analyzed, over and above that due to any other factors. The following equation estimates the predicted cumulative individual cancer risk from inhalation of multiple substances:
Risktot = Risk1 + Risk2 + … + Riski
Risktot = total cumulative individual lifetime cancer risk, across i substancesRiski = individual risk estimate for the ith substance
For NATA, the estimated exposure concentrations are not considered to be upper bound. Rather, they represent central tendency estimates of exposure concentrations for each demographic group at the geographic unit of analysis (e.g., the census-tract level). Because cancer slope factors are not “most probable estimates,” however, but instead are 95-percent upper confidence intervals, summing traditional risk levels can cause the resulting sum to overestimate a 95-percent upper confidence level risk for a mixture.
The NATA approach assumes an additive effect from simultaneous exposures to several carcinogens. Summing cancer risk estimates is not appropriate when effects from multiple chemicals are synergistic (greater than additive) or antagonistic (less than additive).
I would be glad to expand upon or discuss these important matters at your convenience.
Sincerely,
Bill Wolfe, Director
NJ PEER
For interested readers, the EPA national school ambient air monitoring initiative sampled outdoor air quality for a handful of pollutants at two NJ schools – hit the links for one in Mabel Holmes Middle School in Elizabeth and one in Paulsboro High School.
A summary of the EPA initiative can be found here, the sampled pollutants here and the actual results here.
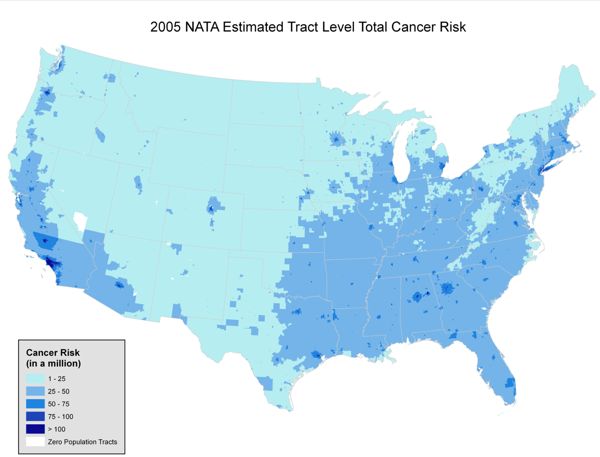
Cumulative Cancer Risks:
NATA estimates that all 285 million people in the U.S. have an increased cancer risk of greater than 10 in one million. 13.8 million people (less than 5 percent of the total U.S. population based on the 2000 census) have an increased cancer risk of greater than 100 in a million. The average, national, cancer risk for 2005 is 50 in a million. This means that, on average, approximately 1 in every 20,000 people have an increased likelihood of contracting cancer as a result of breathing air toxics from outdoor sources if they were exposed to 2005 emission levels over the course of their lifetime
[extrapolating to NJ approximately 8 million population = 400 excess cancer deaths]
Cumulative Noncancer Hazards:
Ideally, hazard quotients should be combined for pollutants that cause the same adverse effects by the same toxic mechanism. However, because detailed information on mechanisms was unavailable for most of the substances considered in this assessment, the EPA used a simpler and more conservative method. Many of the pollutants in this assessment cause adverse effects in humans or animals by irritating the lining of the respiratory system. Although it is not clear that these respiratory effects occur by the same mechanisms for all such air toxics compounds, the EPA protectively assumed that these effects could be added for each target organ. These additive effects were represented by a “hazard index,” which is the sum of the hazard quotients of the 41 air toxics compounds in the 2005 NATA that affect the respiratory. (sic)
The respiratory hazard index was dominated by a single substance, acrolein, which contributed about 75 percent of the nationwide average non-cancer hazard. The respiratory hazard index exceeded 1.0 for approximately 69 million people while the HI exceeded 10 for more than 174,000 people. These estimates for acrolein differ greatly from the 2002 NATA estimates. This is primarily due to the removal of fires, which were a big contributor of atmospheric acrolein in 2002, from the 2005 inventory and assessment.
[extrapolating to NJ = 1.937 million people with respiratory hazard, measured as >1]


Thank you for doing this important work!