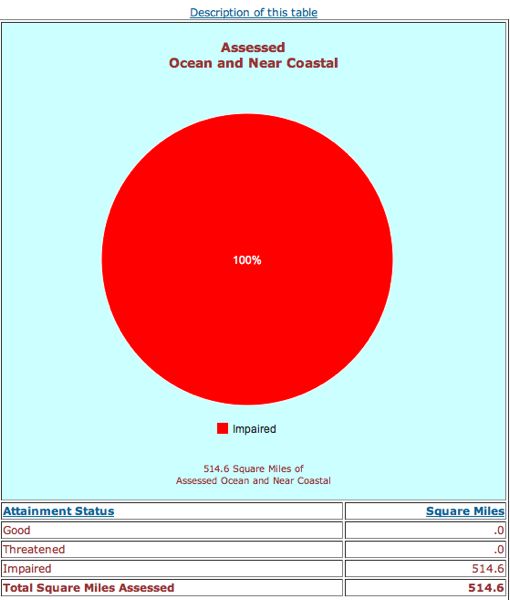
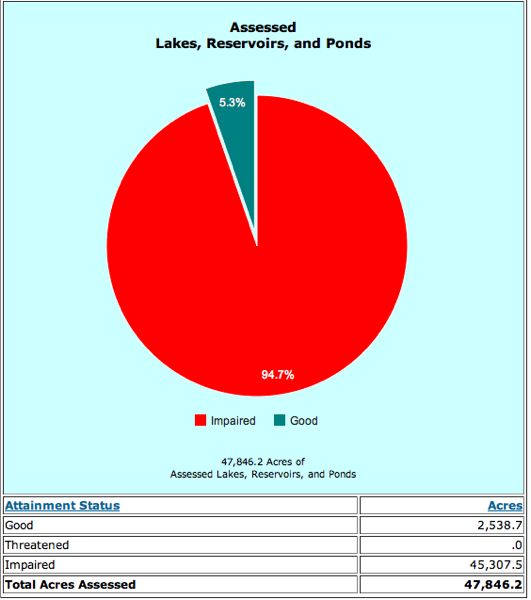
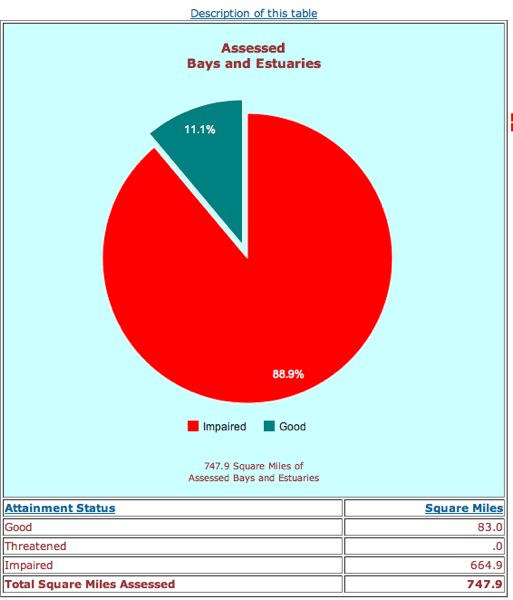
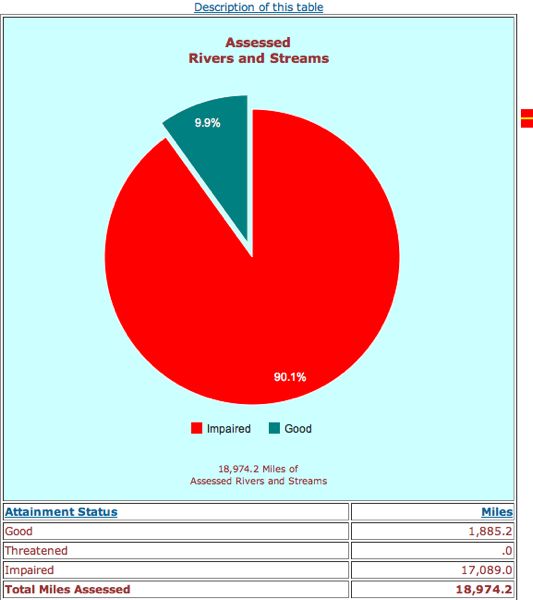
According TO US EPA Report, NJ Has the Worst Water Quality in the Country – Over 90% of Rivers, Lakes, Streams, Bays, and Ocean Are Polluted, Unhealthy, and Fail to Meet Clean Water Act Standards
Christie Administration’s Deregulation and Disinvestment Bring Dirty Water
NJ Waters Fail to Meet Standards and DEP Cleanup Plans Are Ineffective
All While US EPA Lamely Asks: How’s My Waterway?
Source: US EPA
Last week, we wrote about how the Christie Administration’s austerity policy was accelerating the deficit in clean water infrastructure – both wastewater treatment and drinking water systems, see:
We also posted a few pictures of one stream negatively impacted by the Fenimore landfill, see:
Of course, the “insidious ecological decline” of Barnegat Bay is another example of Clean Water Act impairment we’ve written in some detail about.
And for years, we have written about Gov. Christie’s deregulation and privatization policies.
So today, we put it all in context, based upon the data in US EPA’s new “enhanced version of “How’s My Waterway” app and website initiative.
We thought we’d outline some of the consequences off that set of Christie policies, in terms of clean water in NJ. (hit link for complete picture).
WASHINGTON — The U.S. Environmental Protection Agency (EPA) released an enhanced version of “How’s My Waterway,” an app and website to help people find information on the condition of thousands of lakes, rivers and streams across the United States from their smart phone, tablet or desktop computer.
The How’s My Waterway app and website, http://www.epa.gov/mywaterway, uses GPS technology or a user-entered zip code or city name to provide information about the quality of local water bodies. The new version of the site includes data on local drinking water sources, watersheds and efforts to protect waterways, as well as a map-oriented version of “How’s My Waterway” designed for museum kiosks, displays and touch screens, available at: http://watersgeo.epa.gov/mywaterway/kiosk/.
“Communities and neighborhoods across the U.S. want to know that their local lakes, rivers and streams are healthy and safe to enjoy with their families, and providing that information is a priority for EPA,” said acting assistant administrator for EPA’s Office of Water Nancy Stoner. “The enhanced version of ‘How’s My Waterway’ provides easy, user-friendly access to the health of the places we swim, fish and boat, where we get our drinking water, and what is being done to curb water pollution. People can get this information whether researching at a desktop or standing streamside looking at a smart phone.”
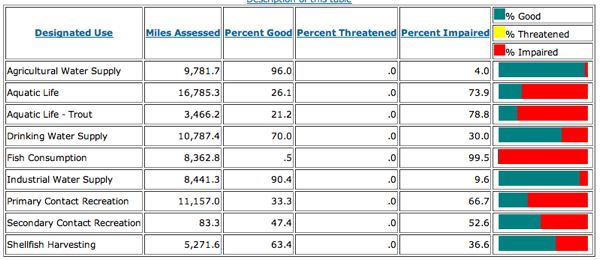
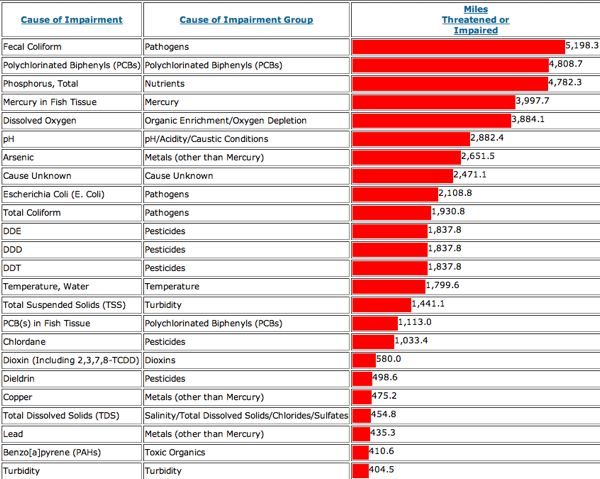
Take a look at some of the “NJ highlights” – I wish EPA made strict enforcement of the Clean Water Act as high a priority as providing information via websites and trendy user friendly app’s.
US EPA
US EPA
US EPA
US EPA
US EPA